

SQL 🐱💻
SQL is the foundation of data analysis. It allows you to extract, clean, and organize information from massive databases with just a few lines of code. Every modern company relies on SQL to turn raw data into insights, making it one of the most in-demand skills in the market.

Power BI 🚀
Power BI is Microsoft’s powerful business intelligence tool designed to transform complex data into clear, interactive dashboards. With automation and seamless Excel integration, it helps organizations make smarter, faster decisions.

Tableau 🎨
Tableau is the industry leader in data visualization. Its intuitive interface lets you build dashboards that reveal hidden patterns and insights at a glance. By mastering Tableau, you’ll stand out as someone who can transform raw numbers into stories that drive decisions.

DAX
DAX (Data Analysis Expressions) is the core language that powers calculations in Power BI.
By mastering DAX, you’ll unlock the true analytical power of Power BI, building reports that respond intelligently to filters, user selections, and business logic—making your dashboards truly come alive.

Python 🐍
Python is one of the most versatile programming languages, ideal for automating analysis, building dashboards, and managing data workflows. Its rich ecosystem makes it the go-to language for data science and machine learning.

SAS 🧬
SAS (Statistical Analysis System) is one of the most established tools in data analytics, especially in large enterprises and research. It’s designed for advanced statistical modeling, data management, and reporting.
With SAS, you can clean, transform, and analyze complex datasets with ease — from predictive models to business insights. Mastering SAS gives you a competitive edge in industries like healthcare, finance, and telecommunications, where data accuracy is critical.

What You’ll Learn in Power BI 🚀
(10+ Hours) = 5+ Dashboards
- Exploratory Data Analysis (EDA)
- Power Query – Data Cleaning Made Simple
- DAX (Data Analysis Expressions)
- Data Modeling
- Star Schema vs Snowflake models
- Best practices for relationships, hierarchies, and measures.
- Use Case 1: Retail Analytics
- Build KPIs for sales performance.
- Segment customers with ABC and RFM analysis.
- Visualize store performance on maps to see exactly where growth is happening.
- Use Case 2: Call Center Performance
- Monitor KPI dashboards (response time, resolution rates, customer satisfaction)
- Use tooltips and sparklines for deeper storytelling.
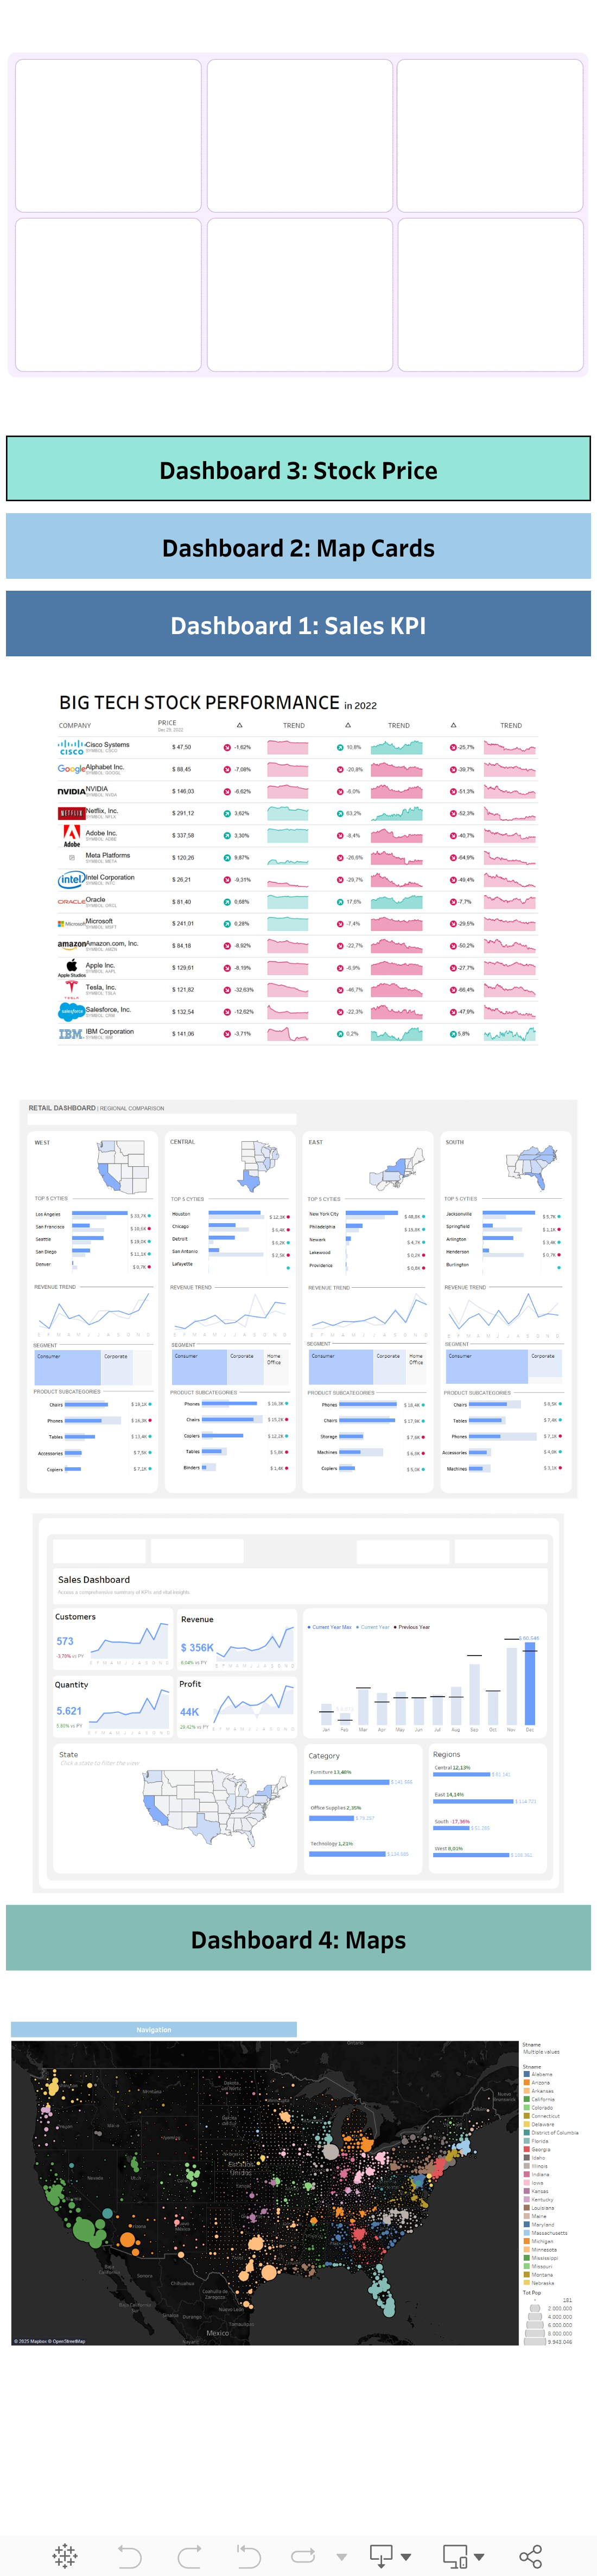
What You’ll Learn in Tableau 🎨
(10+ Hours) = 5+ Dashboards and Use Cases
- Exploratory Data Analysis (EDA)
- Basic Visuals – Build Stunning Dashboards
- Level of Detail (LOD) Calculations
- Maps – Unlock Geospatial Insights
- UI/UX for Dashboards
- Use Case 1: Sales Performance Dashboard
- Use Case 2: Stock Price Analytics
- Use Case 3: Soccer Analytics Dashboard ⚽
-
Use Case 4: Telco Customer Analysis


What You’ll Learn in SQL 🐱💻
(6+ Hours) = Data Manipulation Ninja
Part 1: SQL Fundamentals
- Write basic queries to extract the exact information you need.
- Use functions and conditional logic to transform raw data.
- Apply filters and aggregations (SUM, COUNT, AVG, MAX, MIN) to turn millions of rows into clear insights.
Part 2: Advanced Querying & Data Manipulation
- Master JOINS to combine multiple tables into one powerful dataset.
- Explore subqueries and set operations to answer advanced business questions.
- Learn PIVOT and UNPIVOT to reshape data into flexible reporting formats.
Part 3: Window Functions – The Analyst’s Secret Weapon
- Rank customers, products, or employees dynamically.
- Calculate running totals, moving averages, and year-to-date values.
Compare each record to the overall dataset for powerful insights.
What You’ll Learn in Python 🐍⚡
(6+ Hours) = Data Science Sidekick
Part 1: Python Fundamentals – Build Your Foundation
✅ No coding background? No problem. Learn Python step by step.
✅ Unlock the power of variables, loops, and functions to think like a programmer.
Part 2: Data Analysis with Pandas – Your New Superpower
✅ Transform messy spreadsheets into clean, structured datasets in seconds.
✅ Create workflows that save time and give you answers faster than Excel ever could.
Part 3: Data Visualization – Tell Stories with Data
✅ Build stunning charts with Matplotlib & Seaborn.
✅ Spot trends, highlight opportunities, and wow your audience with visuals.
Part 4: Automation & Web Scraping – Work Smarter, Not Harder
✅ Automate repetitive tasks like reporting and file updates.
✅ Scrape websites to collect valuable, real-world data on demand.
✅ Create small scripts that save you hours every week.


What You’ll Learn in SAS 🧬
(10+ Hours) = 100+ Hands-On Exercises
- Data Manipulation Basics
- Use the DATA Step to clean, filter, and transform data.
- Apply key statements like
KEEP,DROP,IF-THEN-ELSE, andDO.
Summarizing & Exploring Data
- Generate quick insights with
PROC FREQ,PROC MEANS, andPROC UNIVARIATE. - Format, group, and label results for better readability.
Import & Transform Data
- Import CSV, Excel, TXT files using
PROC IMPORT. - Convert variables with
PUT()andINPUT()functions. - Work with dates using
INTCK,INTNX, andYRDIF.
Combining & Automating Processes
- Merge or stack tables with
SET,MERGE, andPROC APPEND. - Simplify repetitive work using loops and arrays.
- Transpose data easily with
PROC TRANSPOSE.
Reporting & Visualization
- Create pivot-style summaries with
PROC TABULATE. - Build professional reports with
PROC REPORTand custom formats.